Pagespeed Insights: What you need to understand?
Hello! If your website takes too long to load or isn’t ranking well on Google, you’re not alone. Google’s PageSpeed Insights, or PSI, is a free tool that checks your site’s speed and gives you tips to make it faster. Speed matters: 53% of mobile users leave a page if it takes over 3 seconds to load (Google, 2017). A slow site can frustrate visitors and lower your search engine rankings. In this guide, we’ll explain the main PageSpeed Insights metrics in simple terms, why they’re important, and how to improve them with practical steps and a few advanced techniques. Let’s get started!
What is PageSpeed Insights?
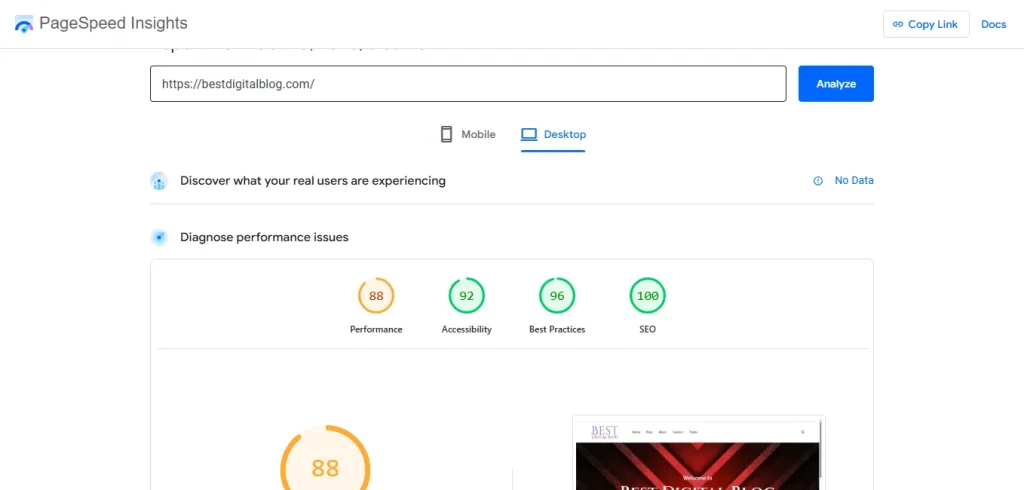
PageSpeed Insights is Google’s tool for analyzing how quickly your website loads on mobile devices and desktops. You enter your site’s URL, and PSI provides a score from 0 to 100, plus suggestions for improvement. It uses two types of data to evaluate performance. First, lab data comes from controlled tests using Google’s Lighthouse tool, simulating a mid-tier phone on a 4G network. Second, real-world data, gathered from actual visitors through the Chrome User Experience Report, shows how your site performs for real users.
Why is this important? A fast website keeps visitors engaged, reduces bounce rates (when people leave quickly), and improves your SEO performance. Since 2021, Google has included Core Web Vitals, a set of PSI metrics, in its ranking factors. Understanding these metrics helps you create a better user experience and climb search results.
The Five Key Metrics of Pagespeed Insights
PageSpeed Insights focuses on five metrics that measure different aspects of your website’s performance. Below is a table summarizing each metric and its target for good performance, followed by detailed explanations.
| Metric | What It Measures | Good Target |
|---|---|---|
| First Contentful Paint (FCP) | Time for first content to appear | Under 1.8 seconds |
| Largest Contentful Paint (LCP) | Time for largest content to load | Under 2.5 seconds |
| Cumulative Layout Shift (CLS) | Unexpected layout shifts during loading | Below 0.1 |
| Total Blocking Time (TBT) | Time page is unresponsive to user input | Under 200 milliseconds |
| Speed Index | How fast visible content fully displays | Under 3.4 seconds |
1. First Contentful Paint (FCP): The First Visual
First Contentful Paint measures how long it takes for the first piece of content, like text or an image, to show on the screen. It’s the moment your site starts to appear. A good FCP is under 1.8 seconds, per Google’s standards.
Why does this matter? A slow FCP can make your site feel unresponsive, causing visitors to leave. Research shows a 1-second delay can cut conversions by 7% (Akamai, 2017). To improve First Contentful Paint, try these steps:
- Speed up your server with better hosting or caching solutions.
- Reduce render-blocking resources, such as large CSS or JavaScript files that delay content.
- Use an advanced technique: Add
<link rel="preload" href="style.css" as="style">in your HTML’s<head>to prioritize critical files, potentially cutting FCP by 100 to 200 milliseconds.
2. Largest Contentful Paint (LCP): The Main Content
Largest Contentful Paint tracks the time it takes for the largest visible element, such as a hero image or headline, to fully load in the viewport. Aim for an LCP under 2.5 seconds.
This metric is critical because it shows when your site feels “ready” to users. A slow LCP increases bounce rates, especially on mobile, where 60% of web traffic happens (Statista, 2025). A poor LCP can lead to 20% more users leaving early (Google, 2020). Here’s how to reduce Largest Contentful Paint:
- Compress images with tools like TinyPNG or use WebP format, which is 25 to 34% smaller than JPEG.
- Implement lazy loading to load images below the viewport only when users scroll to them.
- Try an advanced technique: Use HTTP/2 Server Push to send critical resources, like your hero image, before the browser requests them. This requires server setup but can reduce LCP by 50 to 200 milliseconds.
3. Cumulative Layout Shift (CLS): Prevent Page Shifts
Cumulative Layout Shift measures unexpected movement of page elements during loading, like when an ad pushes content down. A good CLS score is below 0.1.
Page shifts frustrate users, leading to misclicks or difficulty reading. About 70% of users find unstable layouts annoying (Web.dev, 2021). To fix Cumulative Layout Shift, consider these steps:
- Set width and height for images and videos, like
<img src="photo.jpg" width="800" height="400">, to reserve space. - Use CSS placeholders for dynamic content, such as ads.
- Use an advanced technique: Apply
font-display: optionalin your CSS, like@font-face { font-family: 'CustomFont'; src: url('font.woff2'); font-display: optional; }, to use a fallback font if the custom font is delayed, keeping CLS near zero.
4. Total Blocking Time (TBT): Keep It Interactive
Total Blocking Time measures how long your page is unresponsive to user actions, like clicks, due to heavy tasks like JavaScript. Aim for a TBT under 200 milliseconds.
A high TBT makes your site feel frozen, frustrating users who want to interact right away. To improve Total Blocking Time, try these:
- Break up long JavaScript tasks to keep the browser responsive.
- Defer non-critical scripts with
<script defer>or<script async>. - Use an advanced technique: Implement dynamic imports, like
import('./module.js').then(module => module.run());, to load code only when needed, reducing TBT by 100 to 300 milliseconds.
5. Speed Index: Overall Loading Experience
Speed Index measures how quickly your page’s visible content fully displays. A good score is under 3.4 seconds.
This metric reflects the overall loading experience, especially for content users see first. To boost Speed Index, focus on these:
- Prioritize above-the-fold content by inlining critical CSS in the
<head>. - Optimize server response time with faster hosting or compression.
- Use an advanced technique: Implement Early Hints (HTTP 103) to start loading resources before the full HTML response, using
Link: </style.css>; rel=preload; as=style. This can reduce Time to First Byte by 100 to 300 milliseconds with a compatible CDN like Cloudflare.
Core Web Vitals of Pagespeed Insights
FCP, LCP, and CLS are part of Google’s Core Web Vitals, introduced in 2020 as key SEO ranking signals. Meeting these targets for 75% of your users can reduce bounce rates by 24% (Google, 2021). The table above lists the “good” thresholds. Optimizing these metrics improves user experience and helps your site rank higher on Google.
Understanding Your PSI Score
PageSpeed Insights assigns a score from 0 to 100. A score of 90 to 100 (green) means your site is fast, 50 to 89 (orange) indicates room for improvement, and below 50 (red) signals major issues. Mobile scores are often lower due to slower networks and devices, so prioritize mobile optimization since it drives most web traffic. Lab data predicts performance, while real-world data shows actual user experiences.
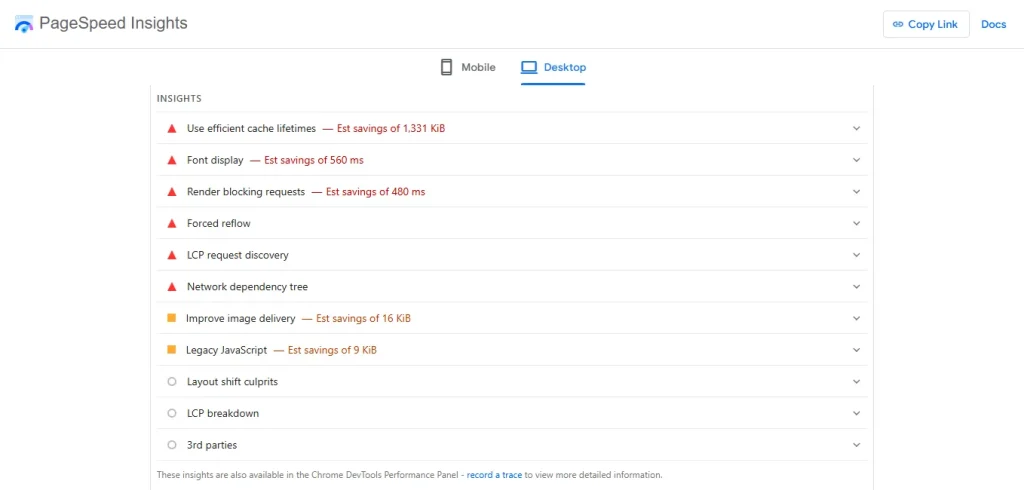
Check PSI’s “Opportunities” section for fixes, like reducing unused JavaScript to save 200 milliseconds.
Practical Ways to Improve Your Site’s Speed
To optimize Core Web Vitals and boost your PageSpeed Insights score, try these steps:
- Optimize images by using WebP format and compressing with tools like Squoosh, cutting file sizes by 50 to 80%. Use our featured image builder. then you will get under 15 KB sized quality featured image in WebP format with 99% quality.
- Minimize blocking resources by inlining critical CSS and deferring non-essential JavaScript.
- Enable browser caching with policies like
Cache-Control: max-age=31536000for faster repeat visits. - Use a Content Delivery Network, such as Cloudflare, to deliver content from nearby servers.
- Improve server response with faster hosting or Brotli compression for 70 to 90% smaller text files.
An advanced technique is to use Client Hints to send smaller images to low-end devices. Add <meta http-equiv="Accept-CH" content="Device-Memory"> to your HTML, and configure your server to deliver optimized assets, reducing LCP by 200 to 400 milliseconds.
Tools to Enhance Your Optimization
PageSpeed Insights is a great start, but other tools can help. Lighthouse, built into Chrome DevTools, offers detailed audits for performance and SEO. Web.dev, Google’s resource hub, provides guides and case studies, like how eBay improved LCP by 1.2 seconds. Chrome DevTools’ Network tab helps identify slow resources. An advanced technique is speculative prerendering with the Speculation Rules API. Add <script type="speculationrules">{"prerender":[{"source":"list","urls":["/cart"]}]}</script> to prerender pages like a checkout page, cutting navigation time by 200 to 800 milliseconds.
Conclusion
Mastering PageSpeed Insights metrics, like FCP, LCP, CLS, TBT, and Speed Index, helps you create a faster, more user-friendly website. A well-optimized site keeps visitors engaged, lowers bounce rates, and improves your SEO performance. Test your site at pagespeed.web.dev, focus on Core Web Vitals, and apply these tips and advanced techniques. Balance speed with great content for the best user experience. Run a PSI test today, and share your results in the comments!
FAQ about Pagespeed Insights
Yes, PageSpeed Insights affects SEO because site speed impacts user experience, Core Web Vitals, and search rankings. Faster pages rank and convert better.
Yes. Pagespeed Insights is a free tool by google. No limit. Unlimited PSI test for free.
The 3 C’s are Content, Code and Credibility.

